Management Dashboard
A built-in web UI for managing findings, rules, governance policies, work items, and audit trails. No separate install — it ships with sentrik.
pip install sentrik
sentrik dashboard
The sentrik dashboard opens automatically in an app window.
Everything You Need. One Dashboard.
Overview
Scan metrics at a glance — severity breakdown, top files, scan duration, cache hit rate, and findings-over-time trend chart.
Findings
Searchable, filterable list of all findings with severity, rule ID, file location, and remediation guidance. Click to expand details.
Reports
Generate and download HTML, JUnit XML, SARIF, and CSV reports. One click for audit-ready artifacts.
Policies
Configure governance profiles (strict, standard, permissive), human review gates, auto-patch settings, and gate thresholds.
Packs
Enable, disable, and configure standards packs. Override individual rules within a pack. Import and export custom packs (Enterprise).
Rules
Browse all active rules with severity, type (regex, AST, file policy), and auto-fix status. Search and filter across packs.
Work Items
View linked Azure DevOps, GitHub, or Jira work items. Reconcile findings — auto-create, update, and close items.
TeamIntegration
Connect to Azure DevOps, GitHub, or Jira. Test connections, configure OAuth, and see environment variable status.
TeamAudit Log
Timestamped log of every scan, gate, reconcile, and config change. Filter by action type. Export for compliance evidence.
EnterpriseApprovals
Async approval gates for enterprise workflows. Review pending requests, approve or reject, track timeout and status.
EnterpriseSettings
Full configuration viewer and editor. Validate config, toggle features, and manage output paths — all from the browser.
See It In Action
Real screenshots from a medical device API project scanned with 4 standards packs (IEC 62304, HIPAA, OWASP, SOC2).
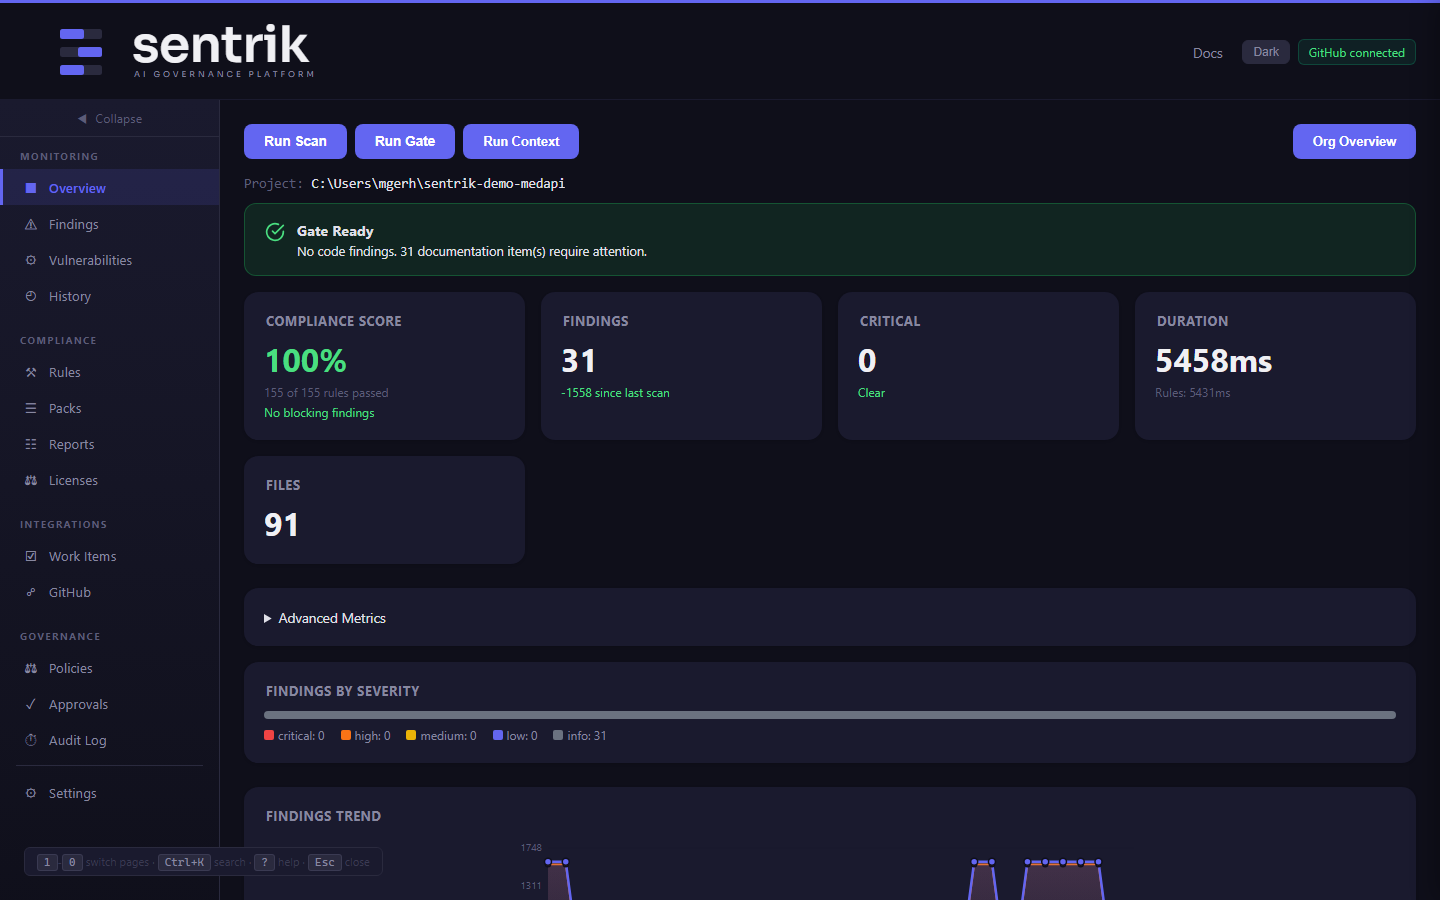
Overview — 100% compliance score, severity breakdown, scan trends
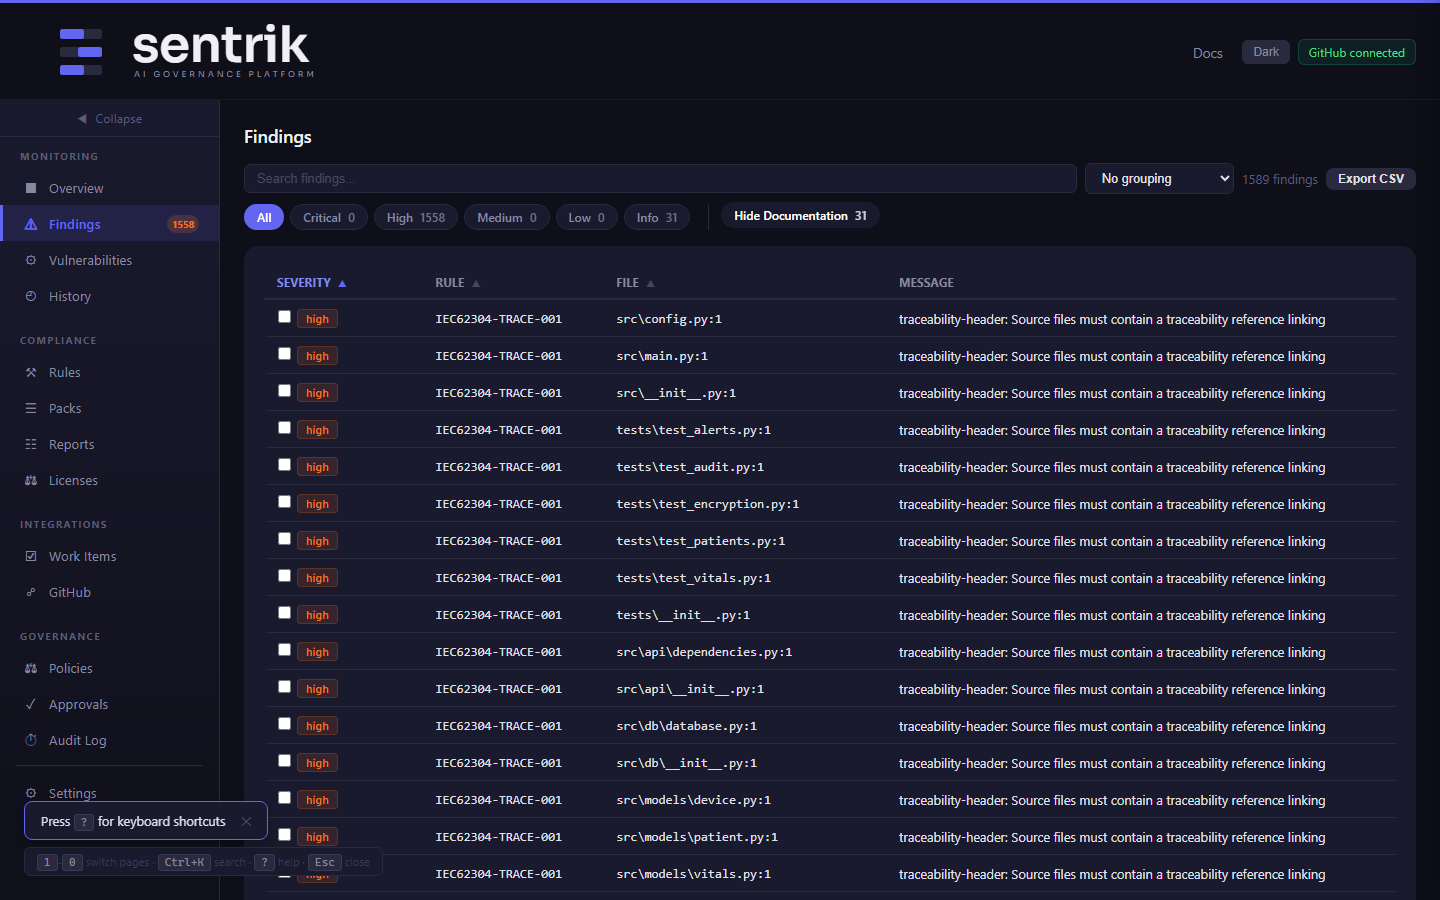
Findings — searchable list with severity, rule ID, and remediation guidance
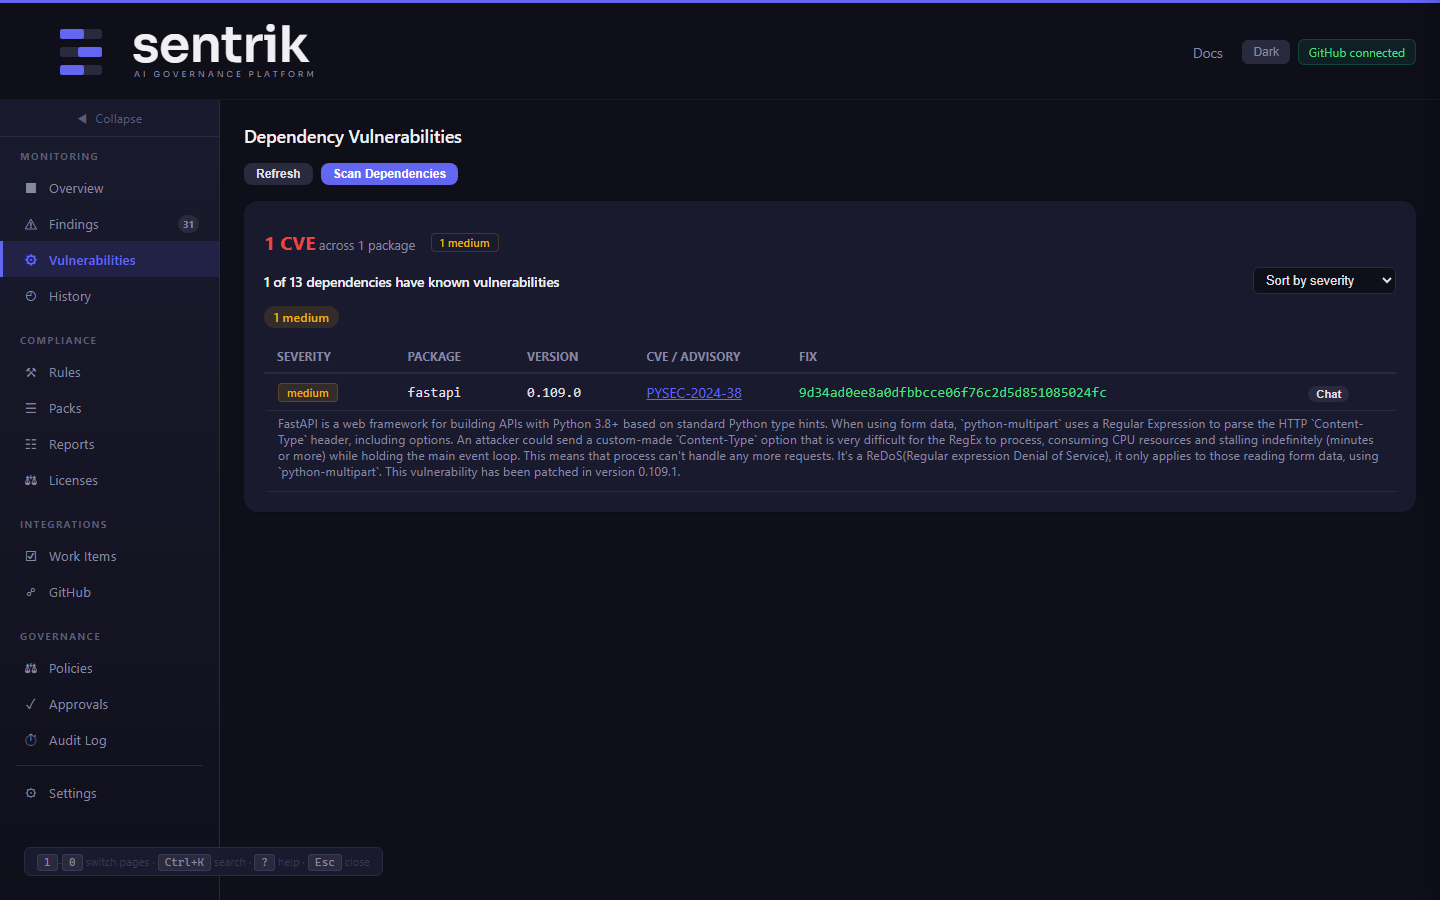
Vulnerabilities — CVE scan results with severity and fix versions
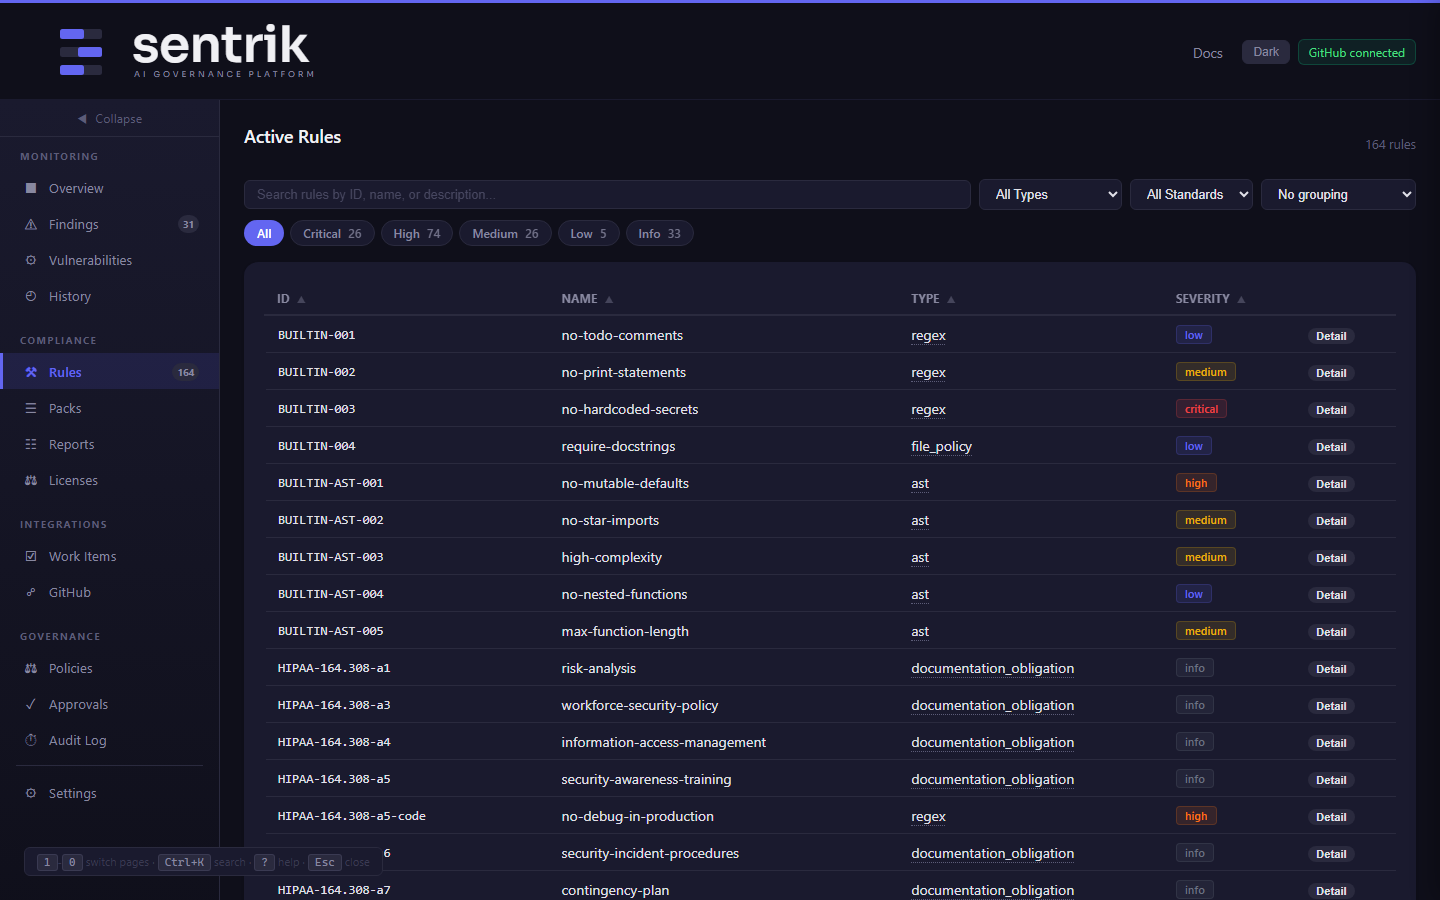
Rules — browse all active rules by severity, type, and standard
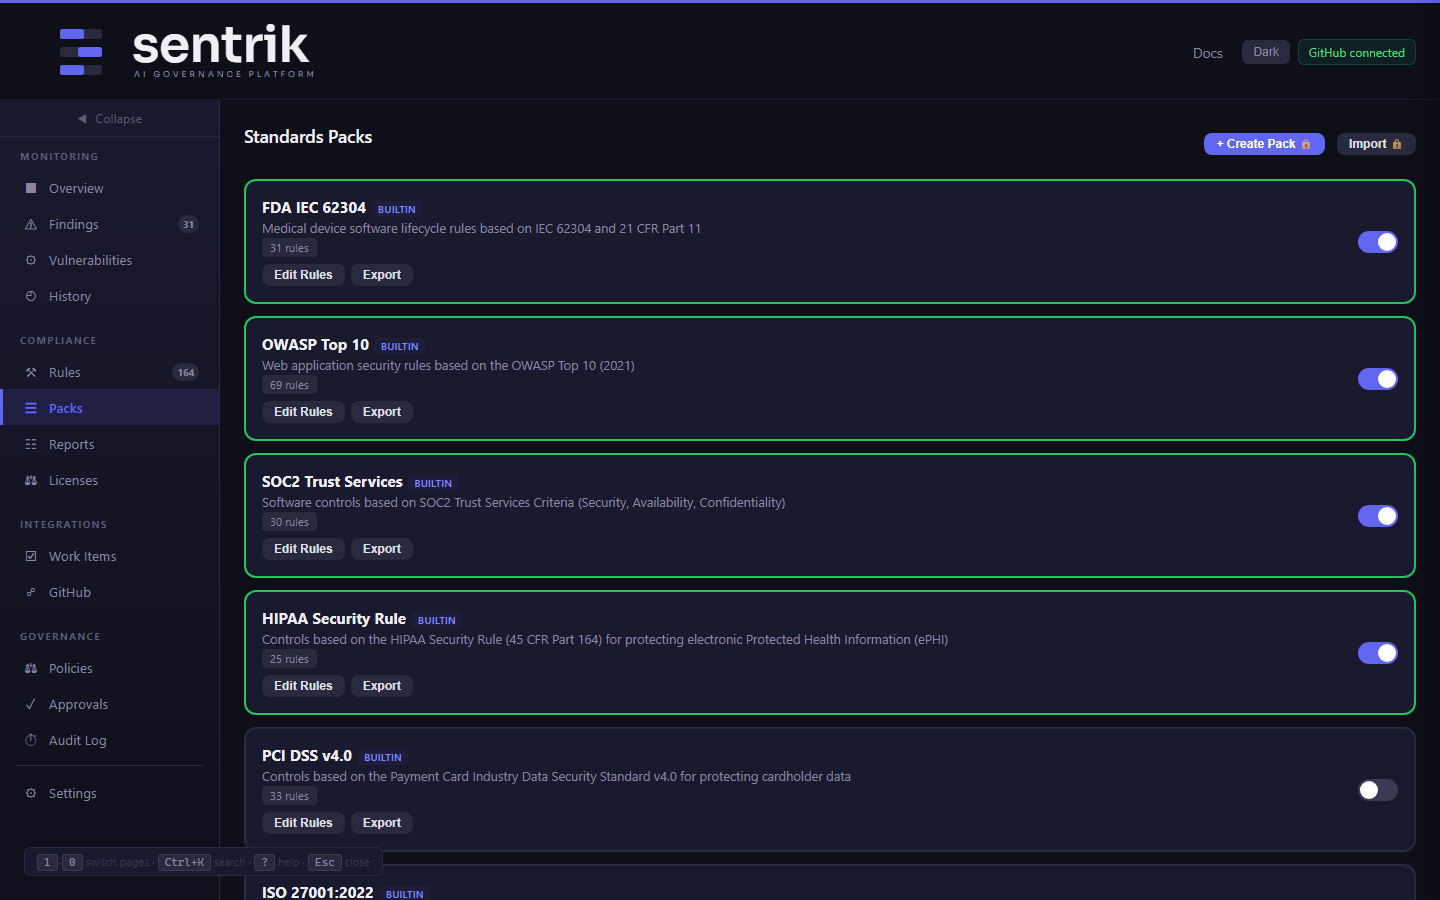
Packs — enable, disable, and configure standards packs
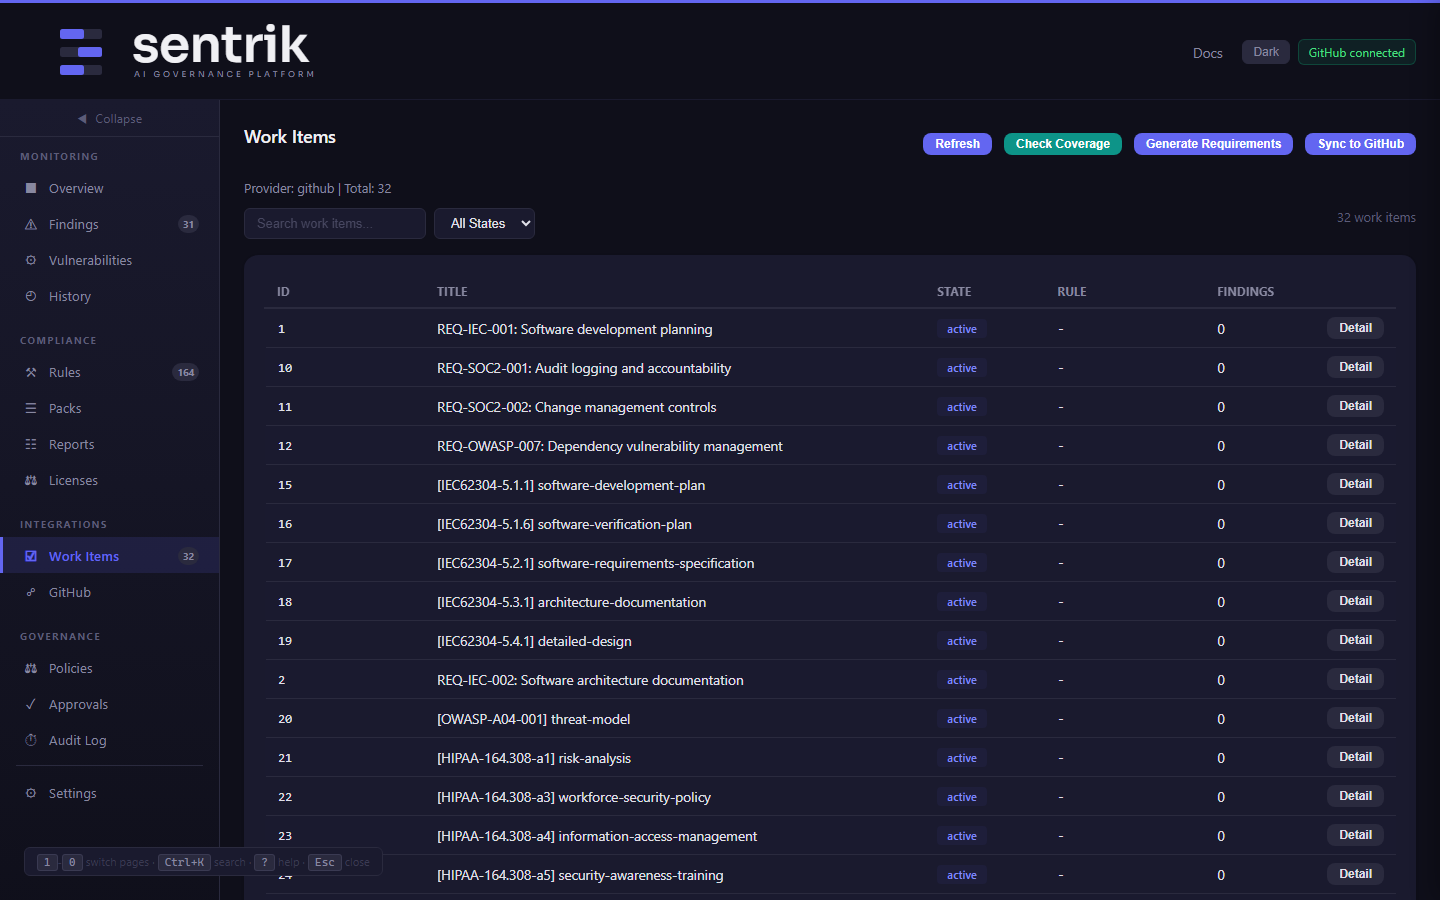
Work Items — synced GitHub Issues with requirement traceability
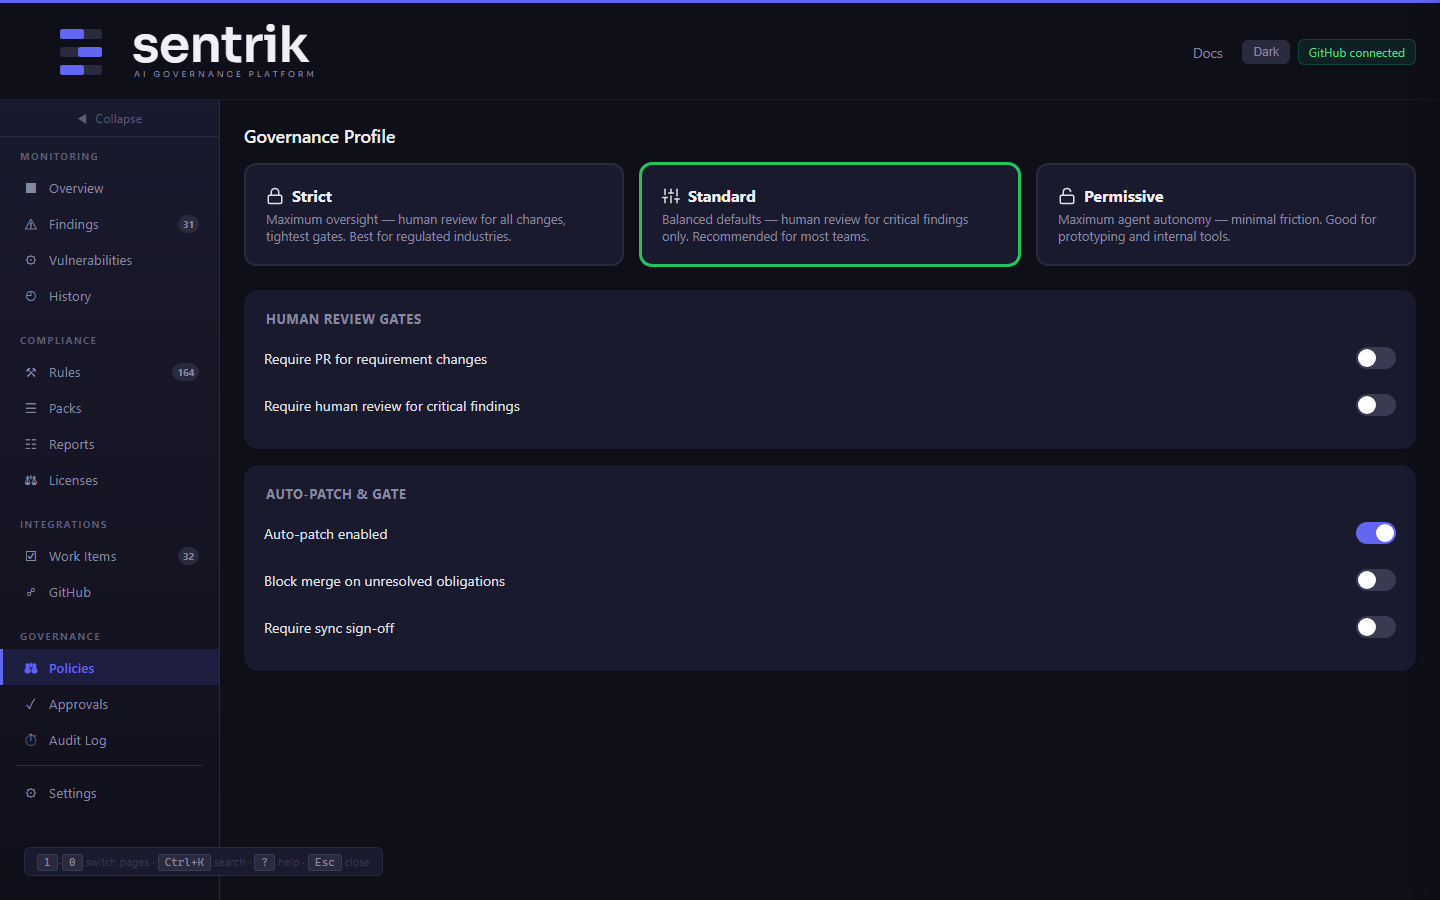
Policies — governance profiles, human review gates, auto-patch controls
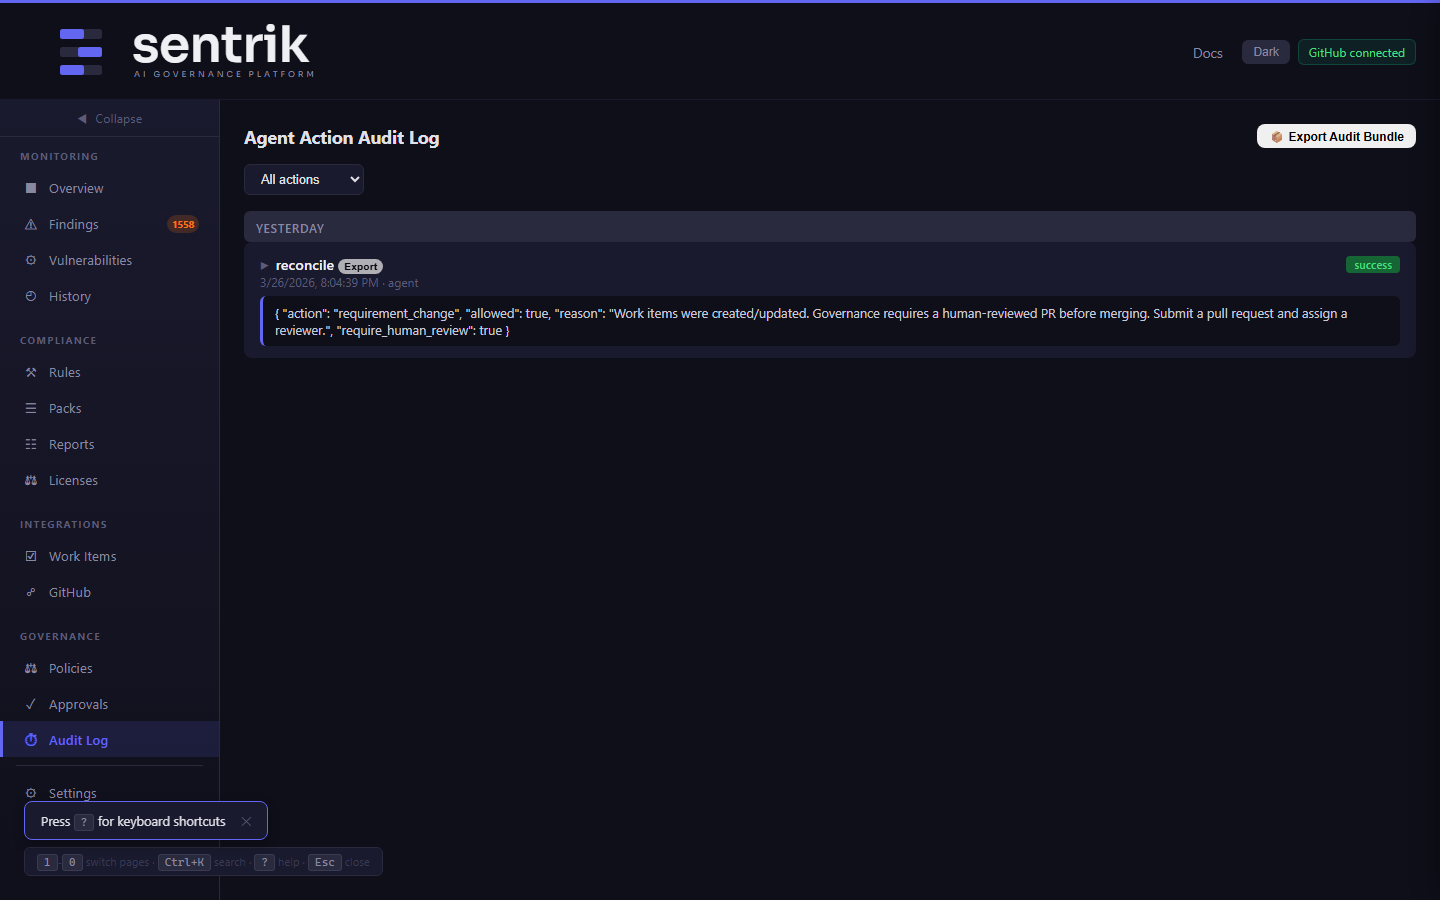
Audit Log — every scan, gate, and reconcile event with HMAC integrity
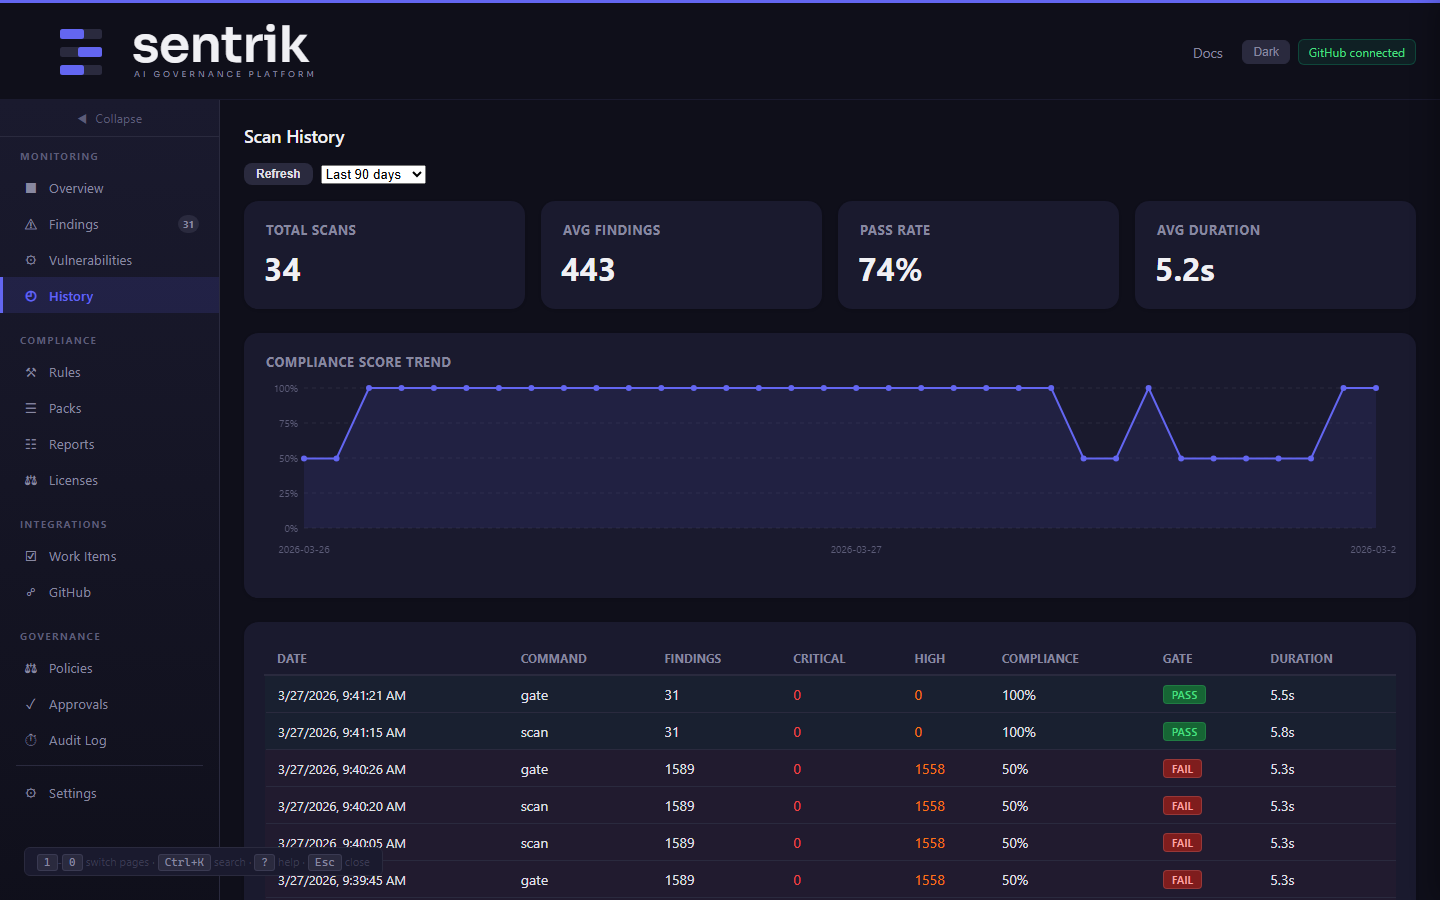
History — historical scan runs with finding trends over time
AI Chat & Vulnerability Triage
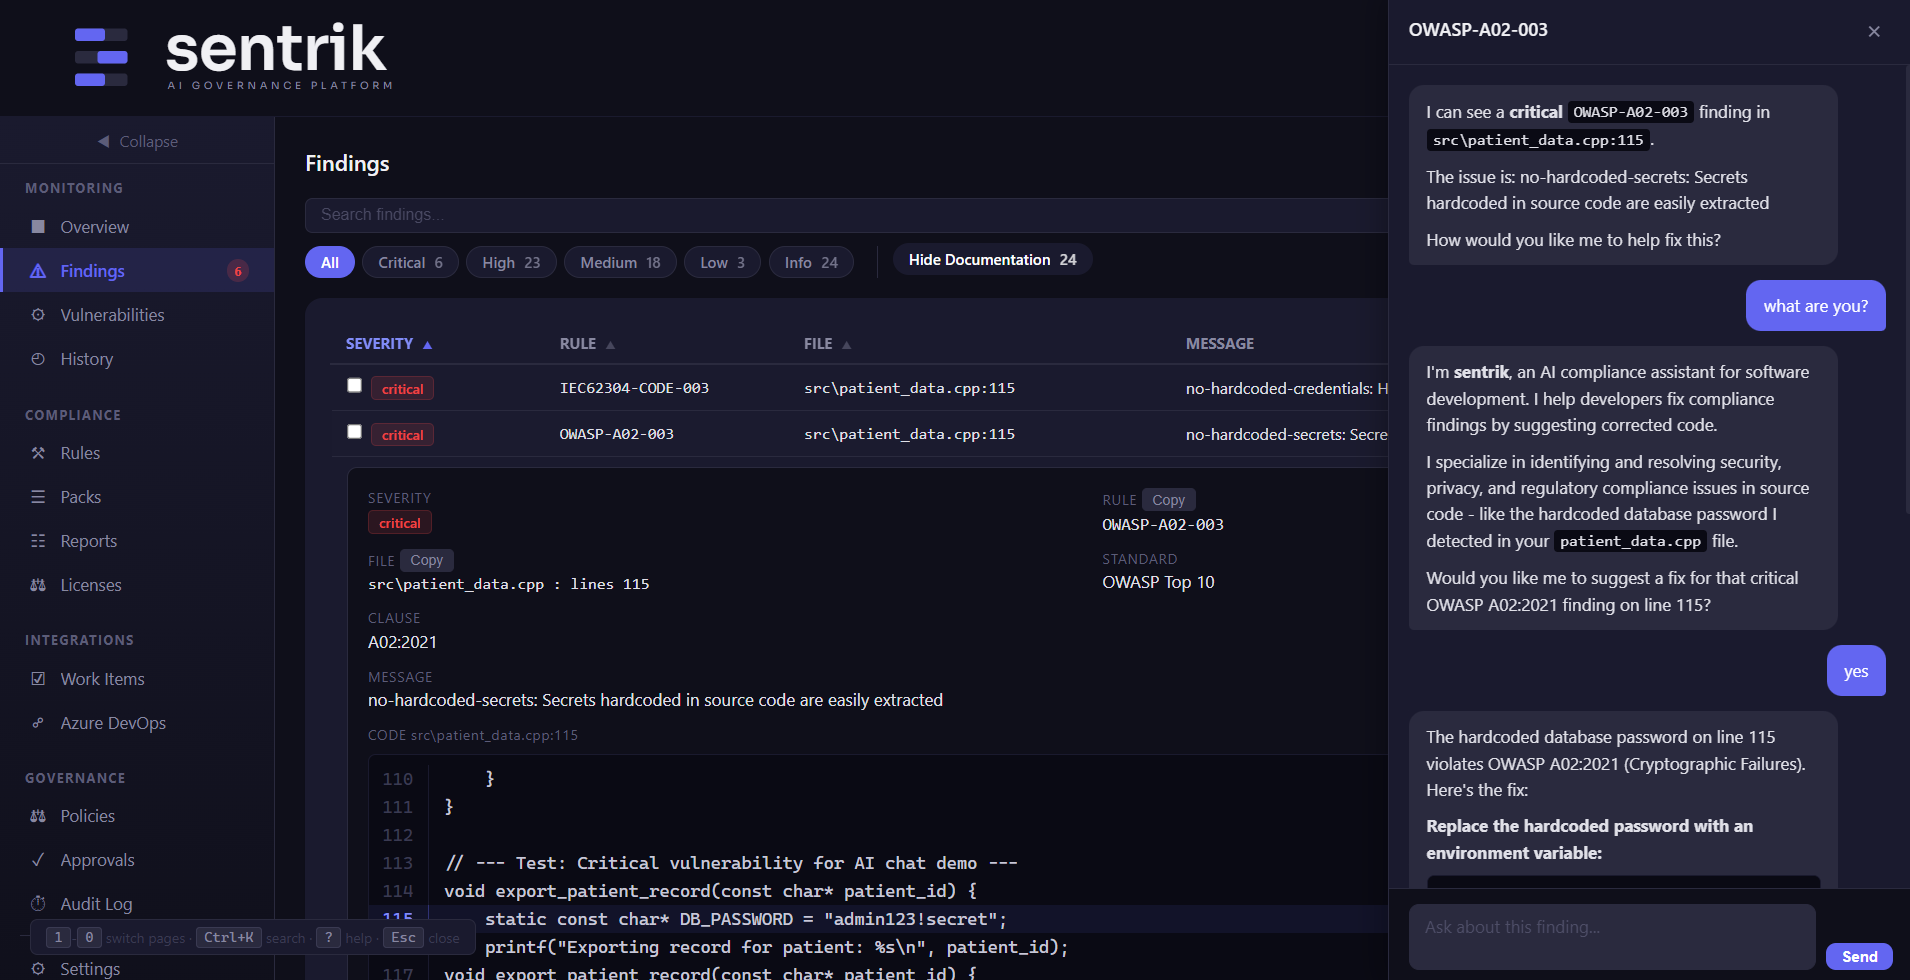
Fix with AI — chat with an LLM about any finding
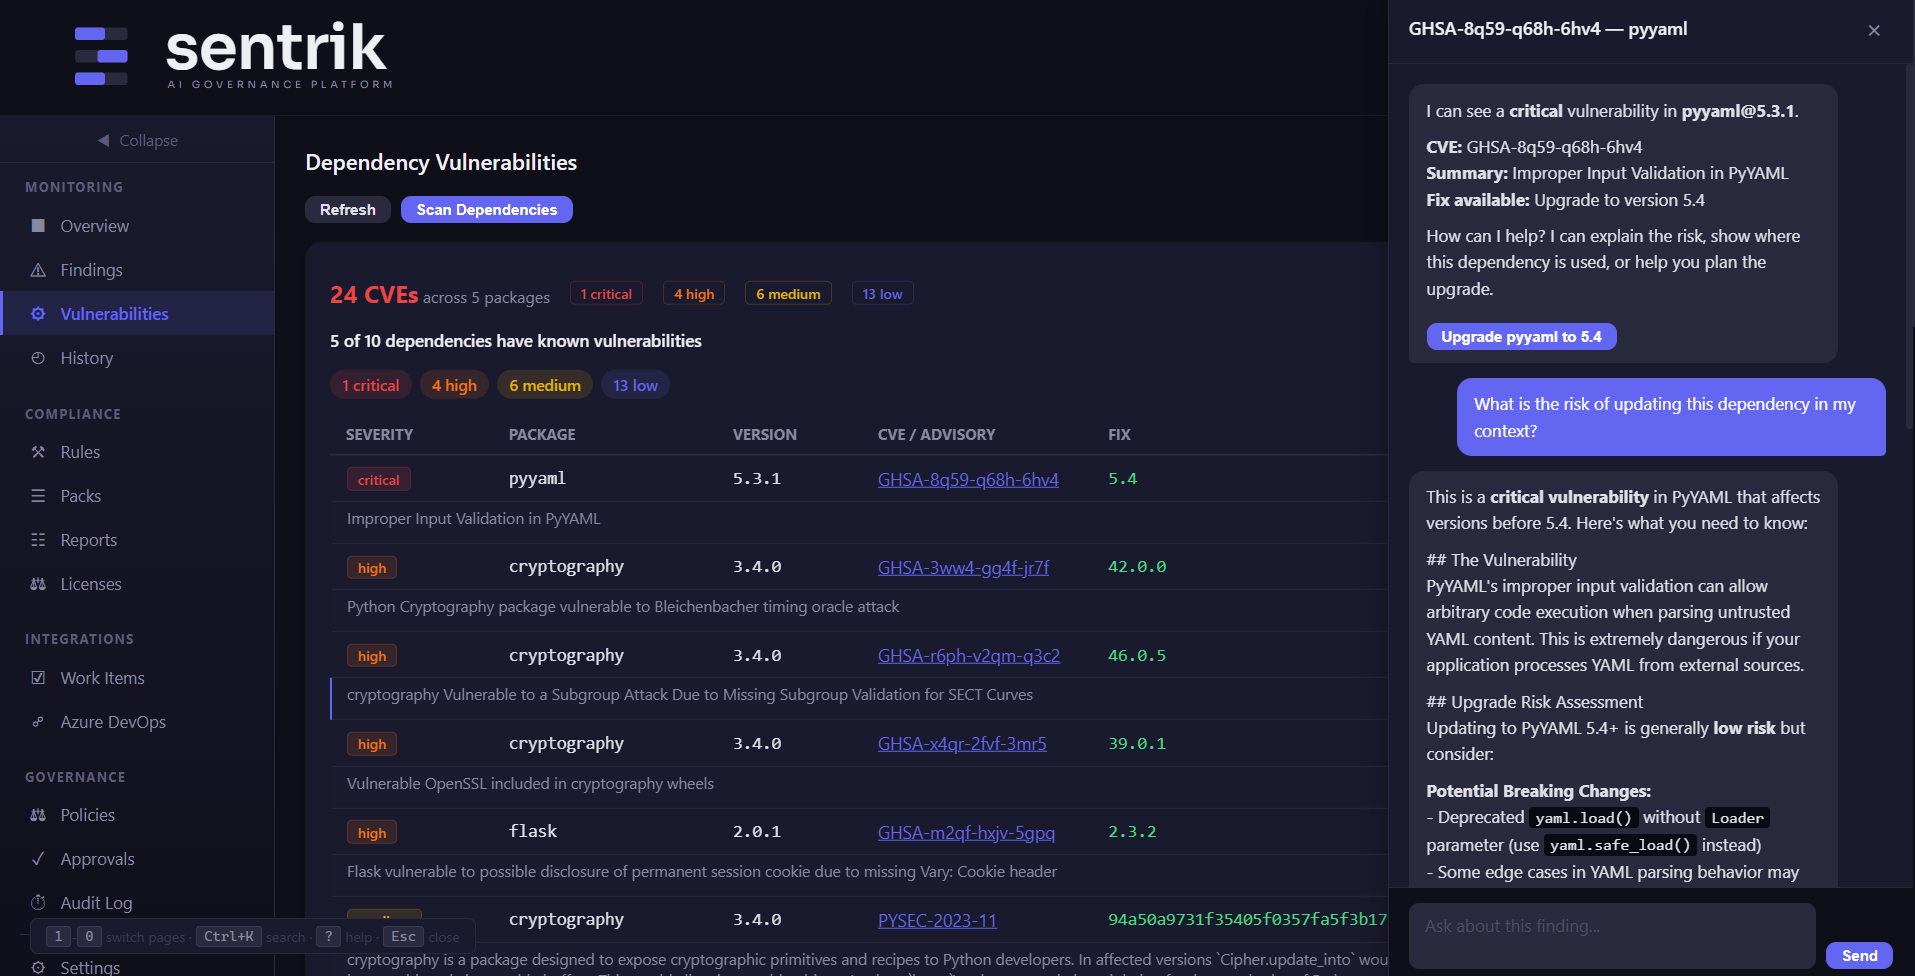
Vulnerability Chat — AI explains CVE impact on your code
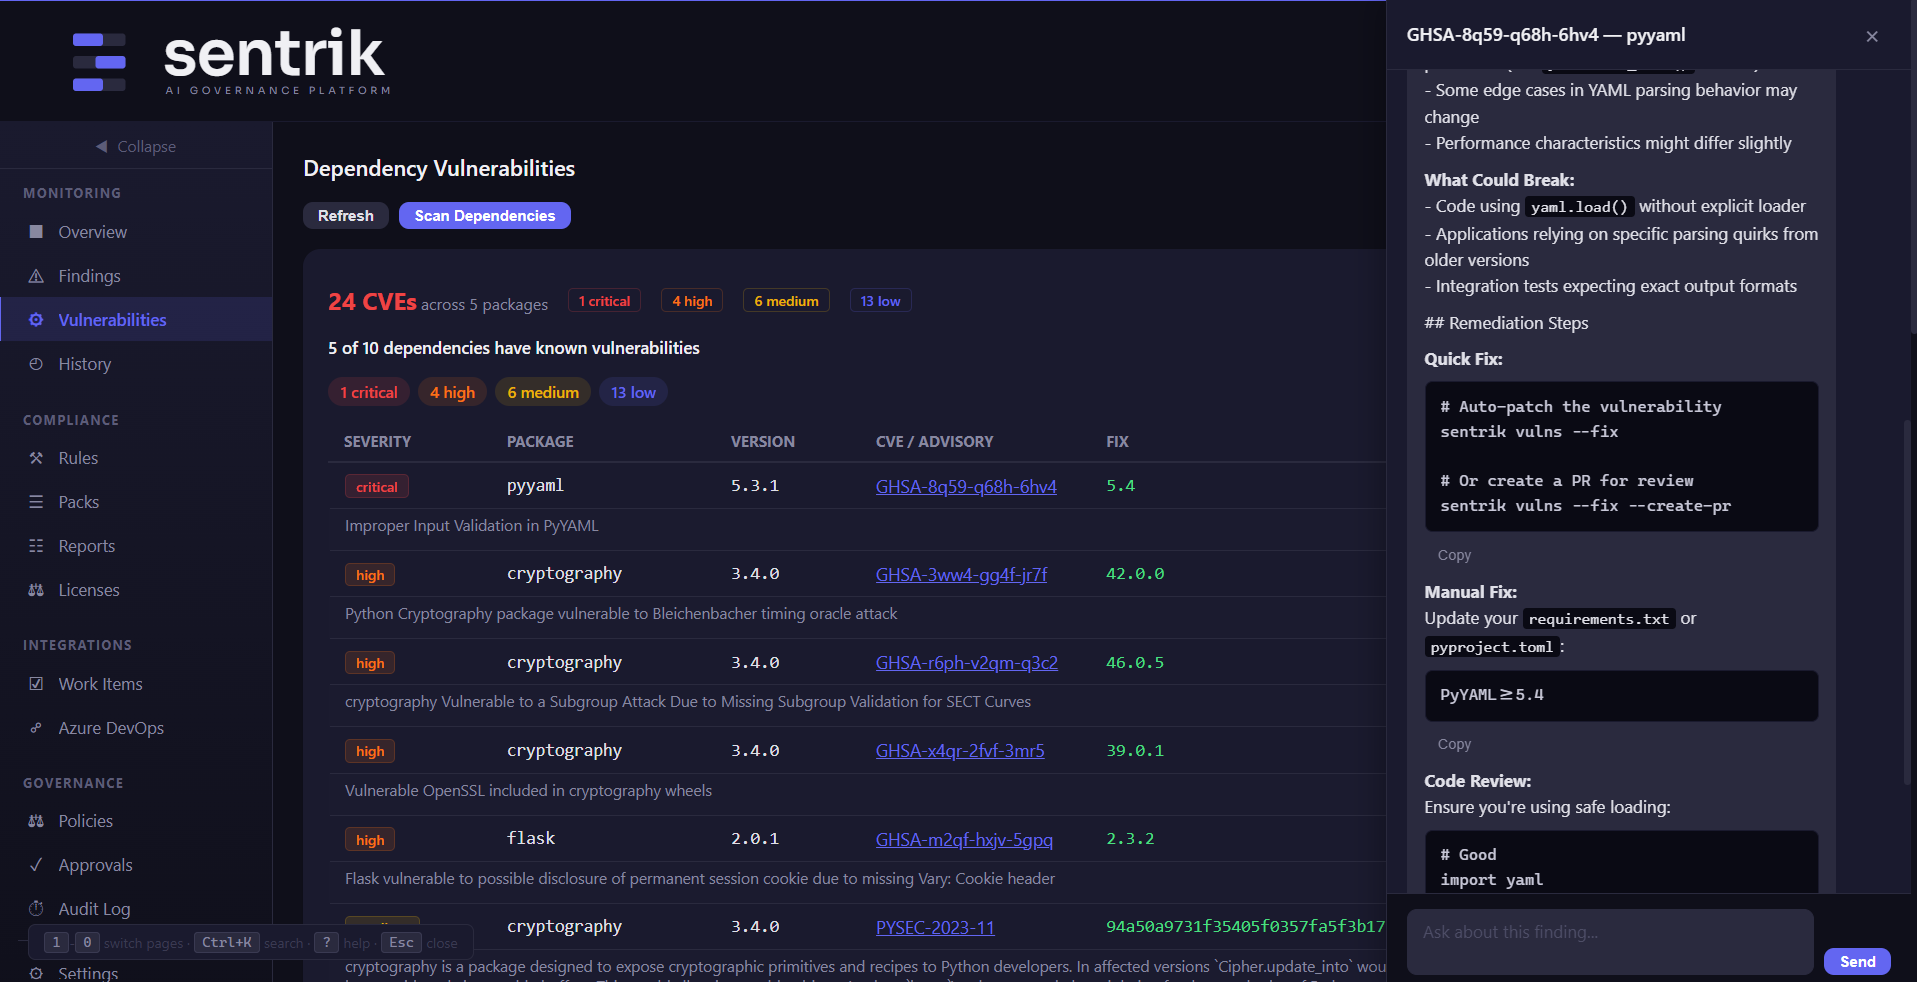
Understand Before You Upgrade — AI checks for breaking changes
Built-In Features
Dark Mode
Light and dark themes with one-click toggle. Preference saved in localStorage.
Global Search
Press Ctrl+K to search across findings, rules, and work items instantly.
Keyboard Shortcuts
Press ? for the help overlay. Navigate tabs, trigger scans, and copy data without touching the mouse.
REST API
25+ API endpoints power the dashboard. Use them directly for CI/CD integration, custom tooling, or remote scanning.
Live Scan Progress
Server-Sent Events stream scan progress in real time. Watch files being processed as they happen.
Scan Trends
SVG line chart showing findings over time. Track whether your codebase is getting cleaner or accumulating debt.